Blog Posts Tagged with Range Contraction
New Scan: Stocks Making a Three-Weeks-Tight Pattern
I just added a scan to find stocks making a 3-Weeks-Tight pattern. This is a pattern that Investor's Business Daily / William O'Neil likes a lot. As they describe it:
Read More ➞CLCD: Another Range Expansion-Contraction-Expansion Trade
As another example of how I'm using this SwingTradeBot to find and track good trades, here's one I closed out today: CLCD.

I posted CLCD to my chart notes the night of September 8th after I noticed it on my Calm After Storm scan. (See my blog post about the Calm After Storm scan for my reasoning for creating that scan.) This is a textbook example of the kind of chart I wanted to find when I dreamed up that scan. CLCD made a huge move on the 6th, pulled back on the 7th and on the 8th started showing signs of stabilizing/consolidating. That's what triggered the Calm After Storm.
Read More ➞Finding and Tracking IPOs to Trade
I've been involved in the market for just over 20 years now and some of my best trades have always been in stocks which IPO'd not long before I bought them. That's because those companies (at least the good ones!) are usually very innovative, are (should be) growing quickly, have small floats and once they break to new highs there's no 'natural' overhead supply of sellers. So one of the things I wanted SwingTradeBot to help me with was tracking IPOs. I generally like to jump into IPOs in two different ways:
- as they break out to a new high
- as they pull back and reverse after a big pop on their IPO day
Investors Business Daily (IBD) / CANSLIM is also a big fan of IPOs. Here's a small sampling of what they've written about IPOs: From IPOs Can Be Risky But Profitable
Read More ➞Introducing the 'Calm After the Storm' Stock Scan
A few days ago I added a new scan which I'd been thinking about for a while. This scan was motivated by a somewhat tedious process I do almost daily during earnings season. I like to find stocks which have had a strong positive initial post-earnings response and then sell off a bit before rebounding. In order find those stocks I would look at the Earnings Movers scan for each of the previous 5 days or so. I would quickly look at those charts (using the hover charts feature) and then more closely inspect any stocks that were setting up to my liking.
The recent action in Shopify (SHOP) is a great example of the type of action I'm trying to find. I happened to catch SHOP setting up intraday on February 19th and I bought some when I saw it rebounding from the lows of the day. Here's the chart:
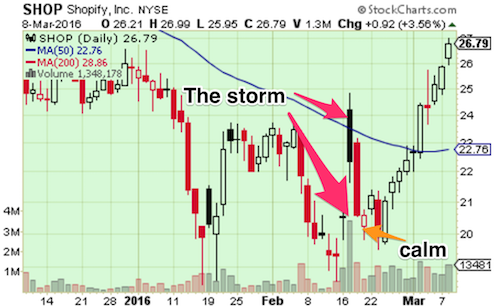
As you can see SHOP gapped up after earnings on the 17th and sold off the rest of the day (a gap & trap). It continued to sell off the next day and closed the gap from the previous day. (Closing the gap isn't a requirement but in this case I took it as a plus.) The action on the 19th (an open narrow-range candlestick after two long/tall dark/closed candlesticks) gave me confidence that the selling was over and that SHOP *might* try to mount a rebound back to the post-earnings high. This is a classic case of volatility swinging from high to low and (hopefully) back to high again. Obviously that trade worked out quite well -- I'm still holding SHOP today with approximately 30% gain.
I see this type of setup a lot but often not until after the rebound move is already underway. So I wanted to create a scan which would unearth these setups for me. That scan is what I'm calling the "Calm After Storm". Here's what it finds:
Read More ➞This is Why I Track Bollinger Band Squeezes (MBLY)
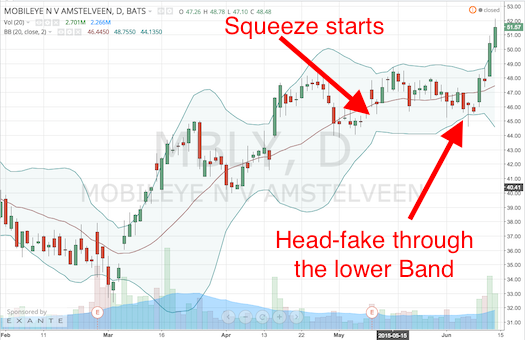
I often talk about how I like to use Bollinger Bands to catch range contraction-to-expansion moves. Just last week Mobileye made a nice move after being in a Bollinger Band Squeeze for a very short time. You can see on MBLY's recent events page that a Squeeze started on May 8th. As I've written before, John Bollinger has noted that you'll often see stocks in a squeeze tag one band and then reverse and shoot through the opposite band:
Traders beware! There is a trick to The Squeeze, an odd turning of the wheel that you need to be aware of, the head fake. Often as the end of a Squeeze nears, price will stage a short fake-out move, and then abruptly turn and surge in the direction of the emerging trend...
So MBLY had all the ingredients to do exactly what Mr. Bollinger laid out. MBLY's trend table page shows that it was trending up and then went trendless (according to ADX & Directional Movement) once the Squeeze began. Then it crossed the lower band and reversed to close back above the lower band and proceeded to launch above the upper band. That was such a strong move that it's now walking up the upper band, which is another classic thing that Mr. Bollinger has written about.
This is why I built the Bollinger Band alerts / scans into the site. I'm always checking the "Bollinger Band Squeeze Started", "Squeeze Plus Upper Band Touch" and "Squeeze Plus Lower Band Touch" scans for trading candidates.
Read More ➞Holiday Reading: MaoXian's Trading for Dummies Series
For those who used to read my old site you know that I'm a huge fan of what's come to be known as the "Dummy" style of trading. I wrote a lot about it back in the day. In my mind the tenets of that style are, to quote myself (there's a lot more detail over there):
Read More ➞
- Keep It Simple, Stupid (KISS)
- Trade with the trend
- Trade only active, liquid stocks
- Define any risk
- Manage risk by adjusting a stop loss order.
- Always enter a protective stop loss order
- Always trade with good reward-to-risk profiles
- Have a well-defined plan and stick to it
Trading the VIX using Bollinger Bands
Back in October, while at Stocktoberfest, I attended a talk by Chris Kimble of Kimble Charting Solutions titled "How to Capitalize on the Technimentals" It was about "how investors can benefit from combining the power of the pattern along with sentiment and fundamentals." As part of that discussion Chris covered a trade he had recently initiated. He got long XIV, the inverse VIX ETN during the mid-October selloff. (He now has a follow-up blog post showing how the trade played out -- looks like he made about a %40 profit in less than 4 weeks). I was really impressed with that strategy, which was basically a bet that volatility would return to its recent norm (mean reversion).
Since then I've been watching the VIX and XIV closely, waiting for a chance to put on a similar trade. As you know, volatility has been spiking of late largely thanks to the slide in the price of oil. So I've been studying the charts of the volatility instruments this week and I noticed something really interesting -- it seems that there are pretty good signals to not only short volatility but also to get long it. If you've spent any time at all on this site you'll notice a lot of mentions of Bollinger Bands and NR7 bars / candles. I use both of those to capitalize on the fact that low volatility begets high volatility (and high begets low). In other words, I'm always on the lookout for prices to swing from periods of range contraction to range expansion.
Read More ➞Popular Now
Recent Comments
- TraderMike on BOOT
- Dr_Duru on BOOT
- TraderMike on Stochastic Reached Oversold
- SuccessfulGrasshopper897 on Stochastic Reached Oversold
- Cos3 on Adding float as advanced filter criteria?
From the Blog
Blog Tags
Featured Articles